
For the past 28 years, I have been involved in crowd safety and risk analysis, and I have been fortunate enough to have been consulted on some of the world’s biggest events, from the annual pilgrimage to Mecca in Saudi Arabia to the royal wedding in 2011.
In many of these instances, the media are intrigued by crowd science and I have worked to provide comment on their news coverage. But nothing could prepare me and my colleague Marcel Altenburg for the media whirlwind that would hit following Donald Trump’s inauguration as 45th president of the United States of America.
This is how this particular journey began: from my house, via The New York Times, to being caught in the middle of a global media frenzy, one in which Trump and his team started what looks to be the first of many disputes with the press.
Rewind a few weeks. I helped The Washington Post to determine how many people Times Square in New York could safely hold for its New Year’s Eve celebrations. Working together, we constructed a fairly scientific newspaper article using our crowd safety algorithms, tools, methodology and projections on safe crowd size numbers. Numbers of 1 million usually get bandied around for Times Square, but when you do analysis on these types of estimates, you find it is usually a tenth of that number.
We have several city-wide events, around the world, claiming the 1 million figure. This is mostly for the publicity. However, it is essential to understand the expected crowd number for crowd safety planning.
Crowd size matters, specifically for planning and resourcing. A safe crowded space for an event is normally estimated at two people per square metre, then adjusted for areas of higher density (front of stage, viewing areas and so on). Our article in The Washington Post outlined the process we use for event planning and the safe holding capacities for major events.
This sparked the interest of The New York Times. So in the run-up to the inauguration, we were asked to provide an estimate of how many people were at the Abraham Lincoln inauguration and a comment on the historical analysis of the crowds at inaugurations down the years. We turned this around in less than a day, which led to the question: “Can you guys do this in real-time?”
At that time, there were various claims that 3 million people would attend the 2017 inauguration.
Hmmm…let me see. Three million people would need between 750,000 and 1,500,000 square metres. There isn’t enough space. To give you some idea of how this would look, I’ve marked out 1,200,000 in the diagram below.
We knew this would be extremely dangerous if the area was packed to this density. There needs to be provision for emergency services, infrastructures, media village, barriers to prevent forward surges and potential crushing. Consequently, this gave birth to our live inauguration analysis, which would later fuel the media fire – Marcel and me giving minute-by-minute crowd updates for the NYT.
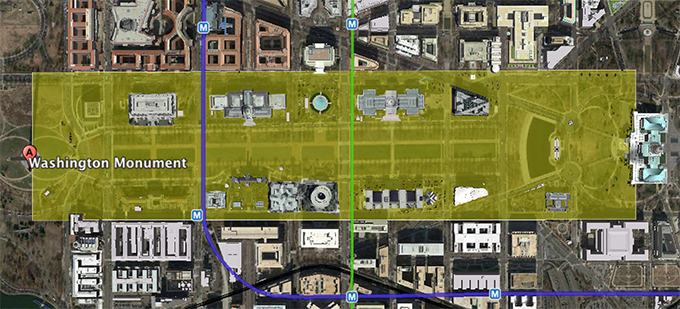
Source: GoogleEarth
As the minutes ticked towards noon in Washington and the oath of office, we watched the crowds arrive, monitoring the build-up and the areas the crowds were occupying. At 11am, we had a comparison image from the 2009 inauguration and were capturing images from seven live broadcast feeds, assessing the metro data and comparing this with previous inaugurations.
The now famous images taken from the Washington Monument that showed the side-by-side comparison of crowd sizes at Barack Obama’s first inauguration and Trump’s were sent to the NYT at 11.15am, and we continued to monitor the crowds.
Comparing the crowds at Donald Trump’s and Barack Obama’s inaugurations https://t.co/YysDewDB9N pic.twitter.com/myrXutzMpH
— NYT Politics (@nytpolitics) January 21, 2017
These images were beamed globally. You can see in the area by the media tent that they were sparsely populated for Trump’s inauguration. Using our formulae, conducting our analysis and using trip arrival data, we were able to establish that Trump’s inauguration was going to be about a third of the size of Obama’s.
This wasn’t the end of our work, however, as we then helped to analyse the Women’s March on Washington. Again, it wasn’t pleasant reading for those who previously projected record inauguration crowds – the Women’s March was in fact three times bigger.
Then came what would be the pivotal moment for the media merry-go-round as Trump’s press secretary made the now infamous “we had the largest crowd – period” statement and the later claim that this was an “alternative fact”.
Suddenly, it got very political – it moved from a scientific debate into the political arena. Somehow, we had become the sole scientists in a war of words between Trump’s team and the media.
On the Monday, Tuesday and Wednesday, we were up to our heads in media requests from all over the world and the phone was ringing non-stop. We appeared in or on: The New York Times; CBS; BBC Radio 4; The Wall Street Journal; The Guardian; Cosmopolitan; Australian TV and radio stations; and the Danish Broadcasting Corporation, to name but a few.
To give a magnanimous assessment, if you are stood at the top of the podium looking out, as Trump will have been, you will have seen a sea of heads – no gaps at all – due to depth perception restrictions and low perspective.
Despite this, we knew that our calculations were right and we stuck with our methodology. It was evident that it had become political. I’m a mathematician, you don’t think your calculations might prove controversial with one of the most powerful men in the world.
Ultimately, as a crowd scientist, it was extremely gratifying to see so many people fascinated with crowd safety and risk analysis. But by Wednesday, after three solid days of working with the media, the adrenaline had worn off for Marcel and me.
We prepared for life to get back to normal – there was, after all, marking and lectures to prepare for.
Author Bio:Keith Still is professor of crowd science at Manchester Metropolitan University. He and Marcel Altenburg run the university’s MSc in crowd safety and risk analysis.