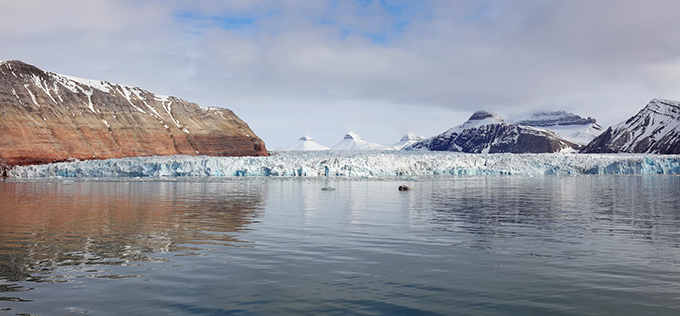
August 22, 2022. Kongsvegen Glacier, 20 km east of Ny Ålesund, in the Norwegian archipelago of Svalbard, as close to the North Pole as Marseille from Paris.
That’s it, we have reached the bottom of the glacier, which is 327 meters below our feet. After drilling in the ice for 6 hours, our hot water jet digs into the sediment. The pipe connecting it to the surface stops unwinding and Thomas Schuler, the leader of our research project , confirms that the base of the glacier has been reached.
I get out of the helicopter and Coline Bouchayer, a doctoral student associated with the project, tells me the good news. Sigh of relief. John Hult, the project engineer, and Svein Oland, a mechanic from the Norwegian Polar Institute, are particularly relieved.
We had tried to carry out the same operation last spring, but the temperatures of -30°C had frozen the water in the drilling system, making it impossible to continue the operation. This time around, the still-running engines bring the smell of diesel to the frozen lands around us.
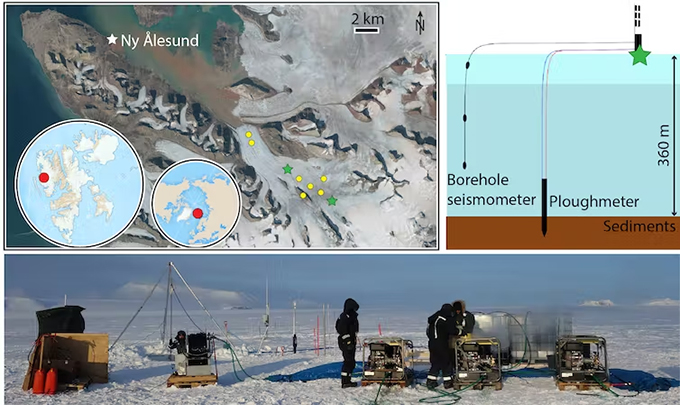
The Kongsvegen, arctic glacier of Svalbard where we conducted our research. To find out what lies hundreds of meters deep, we drilled down to the sediments below the glacier (see green stars). We installed a plow there to measure the forces at the base of the glacier, and several seismometers to listen to its vibrations. We have also installed seismometers at different locations (yellow dots) on the surface of the glacier. Schuler-TV
Our objective here is not to reconstruct past climates by extracting ice cores as missions in Antarctica or Greenland do. Rather, it’s about exploring what’s happening hundreds of meters below the surface, where the glacier rests on its bed of rocks and sediments. This is where its stability comes into play, because the melt water coming from the surface seeps into it and acts as a lubricant.
The rapid increase in temperatures caused by climate change is causing accelerated melting of glaciers, which could trigger many glacial instabilities, as predicted by the Intergovernmental Panel on Climate Change (IPCC) .
Current trends are projected to lead to a warming of about 2.7°C above pre-industrial levels by 2100, well above the upper limit of 1.5°C recommended by the Paris Agreement . Such differences are crucial for glaciers. These sleepy-seeming white whales can wake up a bit too suddenly, as the recent meltdown of glaciers in the Italian Alps shows .
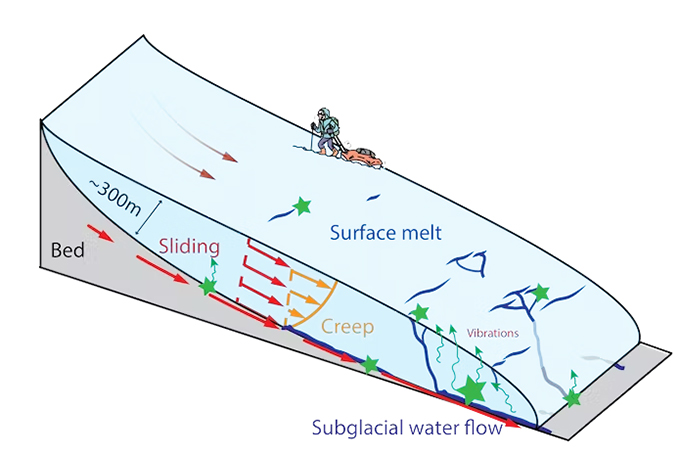
Glaciers move thanks to the presence of liquid water at the interface between the ice and the bed. The slightest movement creates a vibration that can be recorded by our seismometers. Ugo Nanni , Author provided
The movement of glaciers (which can range from a few meters to several kilometers per year) is similar to that of a soft cheese on an inclined board: they swing all their height and crawl under their own weight. The steeper and thicker they are (up to several kilometers), the faster they flow to lower elevations. Thanks to the thin layer of water between the ice and their bedrock, glaciers can double their speed between winter and summer. While most glaciers enjoy a stable seasonal cycle, some, including Kongsvegen (i.e., the King’s Way), have seen their annual velocity increase over the years.
This is called an “ice surge” . Since 2010, the speed of Kongsvegen has increased from a few meters per year to over 40, a tenfold increase. This only concerns the upper part of the glacier for the moment, but we see a progression from year to year towards the lower zones.
This dynamic could lead to a destabilization of the glacier, and if this occurs, this glacier, 15 km long, 2 km wide and 300 meters thick, could plunge into the ocean and cause major damage to the ocean. entire fjord. And Kongsvegen is just one of thousands around the world. It is to understand this that we make our way to the depths and plunge our instruments into the unknown heart of the glacier.
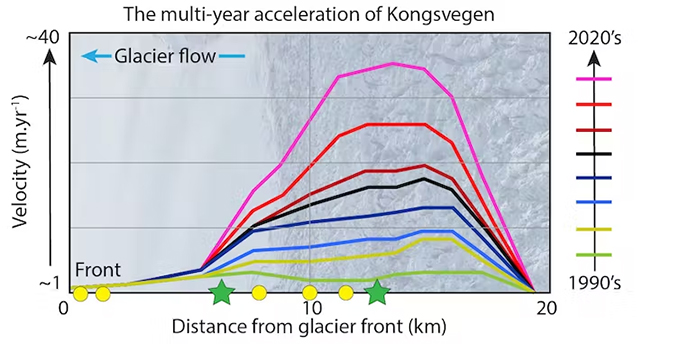
The multi-year acceleration of Kongsvegen measured by Jack Kohler (Norwegian Polar Institute) and his team. It shows that the speed of the glacier has increased from a few meters per year to more than 40 in the upper part of the glacier over the last decade. This acceleration slowly spreads towards the front of the glacier. The background image reveals that this acceleration often leads to the formation of crevasses and could lead to destabilization of the glacier. The yellow dots and green stars show the location of the deployed instrument on the glacier.
Our scientific mission aims to listen to the Kongsvegen and measure the forces it exerts on its underlying bedrock. If these forces exceed what the bed can withstand, we’re going to start having serious problems.
The slightest movement of a glacier generates a vibration that contains crucial information about its dynamics . The sound of glaciers is primitive. It travels from our ears to our guts. We see our desire for exploration as much as our impact on the environment. Are they crying, singing or laughing? Hard to say, in any case they do not remain silent. This year, my friend Clovis Tisserand, sound designer , came with me to record these Arctic voices.
My job is to analyze these sounds to understand how the glacier moves, how it reacts to surface melting, how its crevices open up and what is happening in its depths.
To do this, we use “seismometers”, traditionally used to study earthquakes. Since 2020, we have installed around twenty of them all along the Kongsvegen and in its depths. Such a network allows us to listen to the whole glacier and its secrets (as we did recently in the French Alps , like a doctor armed with his stethoscope.
Deep in the glacier, we have also installed a rather unusual instrument, a 2 meter long steel rod planted at a depth of 360 meters, called a “ploughman”.
On this rod, John has installed several strain gauges to measure the forces that are in play at the base of the glacier. The plow that we installed this summer transmitted its measurements for only a few hours, before sinking into silence despite the efforts of John who tried for days to relaunch it. Fortunately for Coline, whose doctorate partly depends on these measures, the one installed in the spring of 2021 continues to speak to us. Since then, we have been able to measure how the glacier vibrates, deforms and slides in response to changes in temperature and precipitation.
Collecting this data is costly, time-consuming and costly, and subject to many uncertainties. But it was possible thanks to the support of many colleagues, at the Norwegian Polar Institute and its research station Sverdrup, in Ny Ålesund .
Tracking glaciers over the years requires digging in the snow to install our instruments, which are powered by solar panels and batteries. But the Arctic is a harsh environment, and in recovering our data, we risk discovering stations broken by moving glaciers or heavy snowstorms. C. Bouchayer, U. Nanni
Back from the field
When we return from the field, long months go by, spent in front of our computer or around a table converting, filtering and comparing the curves drawn by our observations. We then discover that the dynamics of Kongsvegen are governed by the melting season which runs from June to October, during which several thousand liters of water flow every second over the surface and base of the glacier. According to our observations , the duration and intensity of this melting increase with the progression of temperatures caused by climate change.
All this water lubricates the base of the glacier and causes an increase in speed and stress within it. At the same time, we measure an increase in the intensity of glacial vibrations, linked to hydrological noise and the intense activity of crevasses under the influence of summer heat and the acceleration of the glacier. We observed this summer an increased presence of cracks and measured a stronger stress than last year. This could be a sign of strong acceleration or even destabilization of the glacier.
Our team is currently analyzing these results in order to quantify the causes of these changes, and thus better understand what causes the destabilization of a glacier in a context of melting. Keep your ears open to listen to what will come!
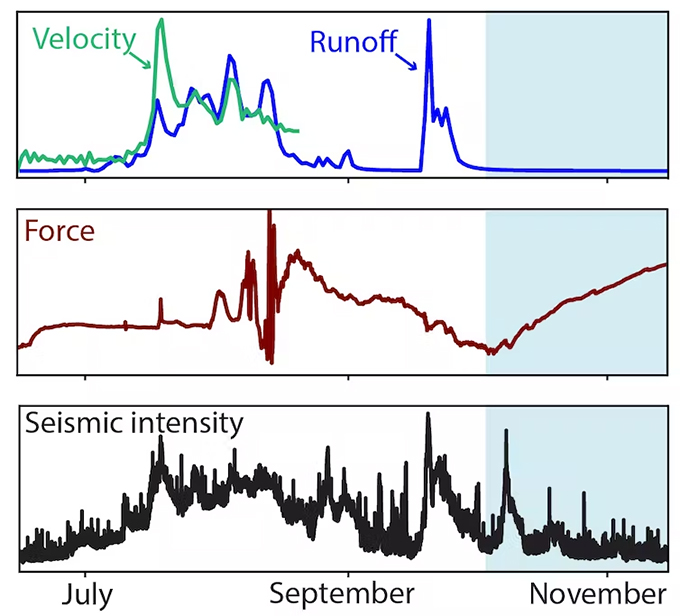
What do you see under a glacier? Time series of measurements collected on the Kongsvegen glacier throughout our mission. Runoff (blue curve) represents the amount of liquid water flowing through the glacier. The force (red curve) represents the stress at the base of the glacier. The seismic power (black curve) represents the amount of “vibration” inside the glacier. The speed of the glacier is represented by the green curve.
Author Bio: Ugo Nanni is a Research Scientist at the University of Oslo